
Power Factor Correction in EV Charging: What ≥0.99 PF Means for Your Grid Connection and Energy Bill

The Invisible Line Item on Your Electricity Bill
The Physics in Plain Language
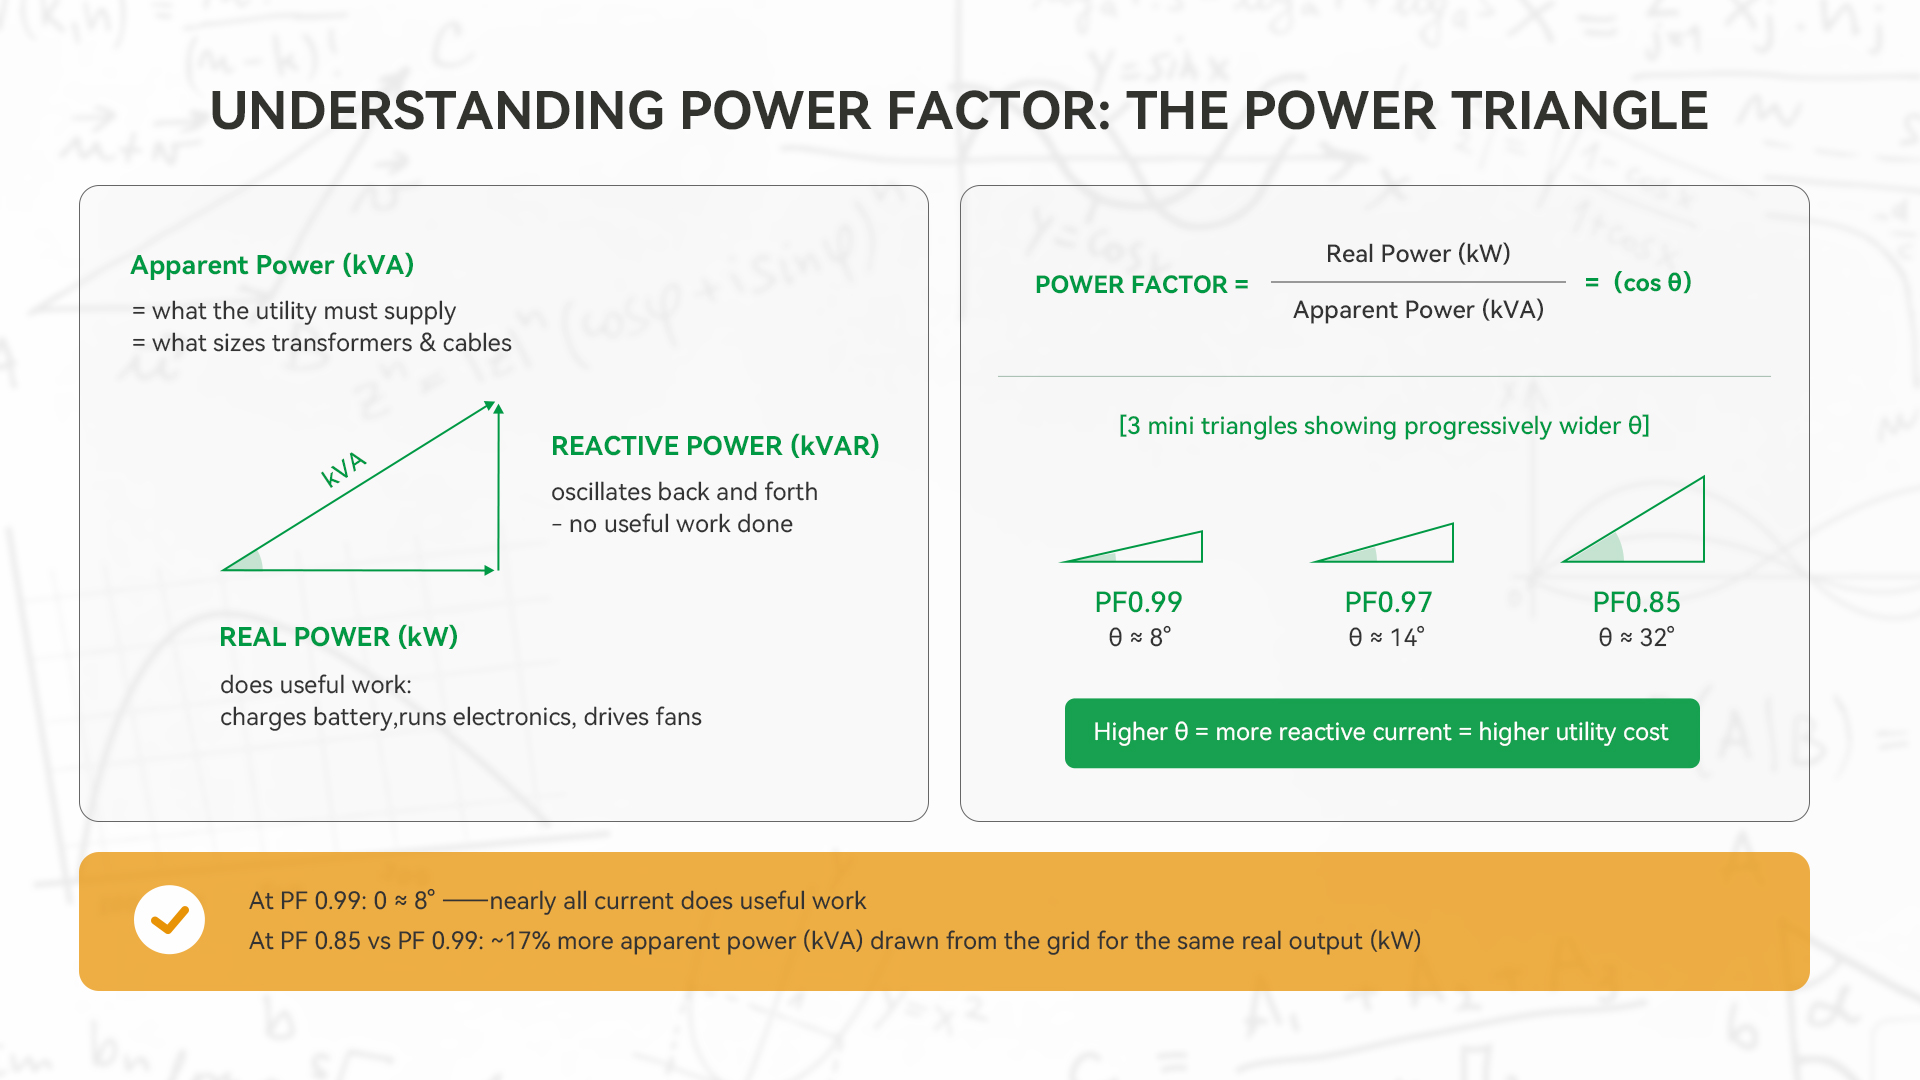
Electrical power comes in two forms. Real power (measured in kilowatts, kW) is the power that does actual work — running the rectifiers that charge a battery, powering the control electronics, driving the cooling fans. Reactive power (measured in kilovars, kVAR) is power that oscillates back and forth between the power source and the load without doing useful work — it's necessary to maintain the electromagnetic fields in inductive components, but it doesn't contribute to the charging output.
The ratio of real power to apparent power (the vector sum of real and reactive power, measured in kVA) is the power factor:
Power Factor = Real Power (kW) ÷ Apparent Power (kVA)
A power factor of 1.0 means all the current drawn from the grid is doing useful work. A power factor of 0.85 means that for every 100 kVA of apparent power drawn, only 85 kW is doing real work. The remaining current — which is real current flowing through real conductors — generates resistive heat, increases line losses, occupies transformer capacity, and reduces the effective power delivery capacity of the grid infrastructure serving the site.
Why Low Power Factor Costs Operators Money
From the perspective of a utility company, a customer with a low power factor is an inefficient user of grid infrastructure. The utility must size its transformers, cables, and switchgear for the full apparent power (kVA) the customer draws, even though it only recovers revenue on the real power (kWh) consumed. This creates a structural cost asymmetry that utilities recover through two mechanisms:
Mechanism 1 — Direct reactive power charges (kVARh billing): Some utilities meter reactive power consumption directly and bill it as a separate line item. This is the structure used by PLN Indonesia for large commercial and industrial customers on tariff categories B3, I3, I4, and P2, where a charge for kelebihan pemakaian daya reaktif (excess reactive power consumption) applies when the site's reactive demand exceeds the threshold set by the connection agreement.[^1]
Mechanism 2 — Adjusted demand charges (kW ÷ PF): Other utilities calculate billing demand not on the metered kW peak, but on an adjusted figure: actual kW demand divided by the measured power factor when PF is below the threshold. A site drawing 500 kW at PF 0.80 is billed as if it is drawing 500 ÷ 0.80 = 625 kW, regardless of what the kW meter reads. This 25% increase in billing demand applies to the demand charge component of the bill — often the single largest line item for commercial electricity users.[^2]
Both mechanisms produce the same result: a charging station operator with low-PF equipment pays more per month than an operator running the same kW load at high PF, using the same utility service, under the same tariff schedule.
The Penalty Landscape: What Operators Are Actually Paying
India: SERCs, State-Specific Thresholds, and Penalty Surcharges
India's power factor penalty framework is governed by a layered structure. The Electricity Act 2003, Section 61, mandates that tariffs should progressively reflect the cost of supply and encourage efficient use of electricity. State Electricity Regulatory Commissions (SERCs) translate this mandate into specific tariff orders that define PF thresholds, penalty rates, and in some cases rebate structures for each state jurisdiction.[^3]
For high-tension (HT) commercial and industrial consumers — the category that encompasses most DC fast charging station operators — thresholds are typically set at 0.90 or 0.95, and penalties are levied per 0.01 of PF below the threshold. In Delhi, DISCOMs apply a penalty surcharge when PF falls below 0.90.[^4] In many states, the penalty rate is typically 1–2% of the demand charge per 0.01 PF below the threshold, varying by state SERC tariff order.[^3]
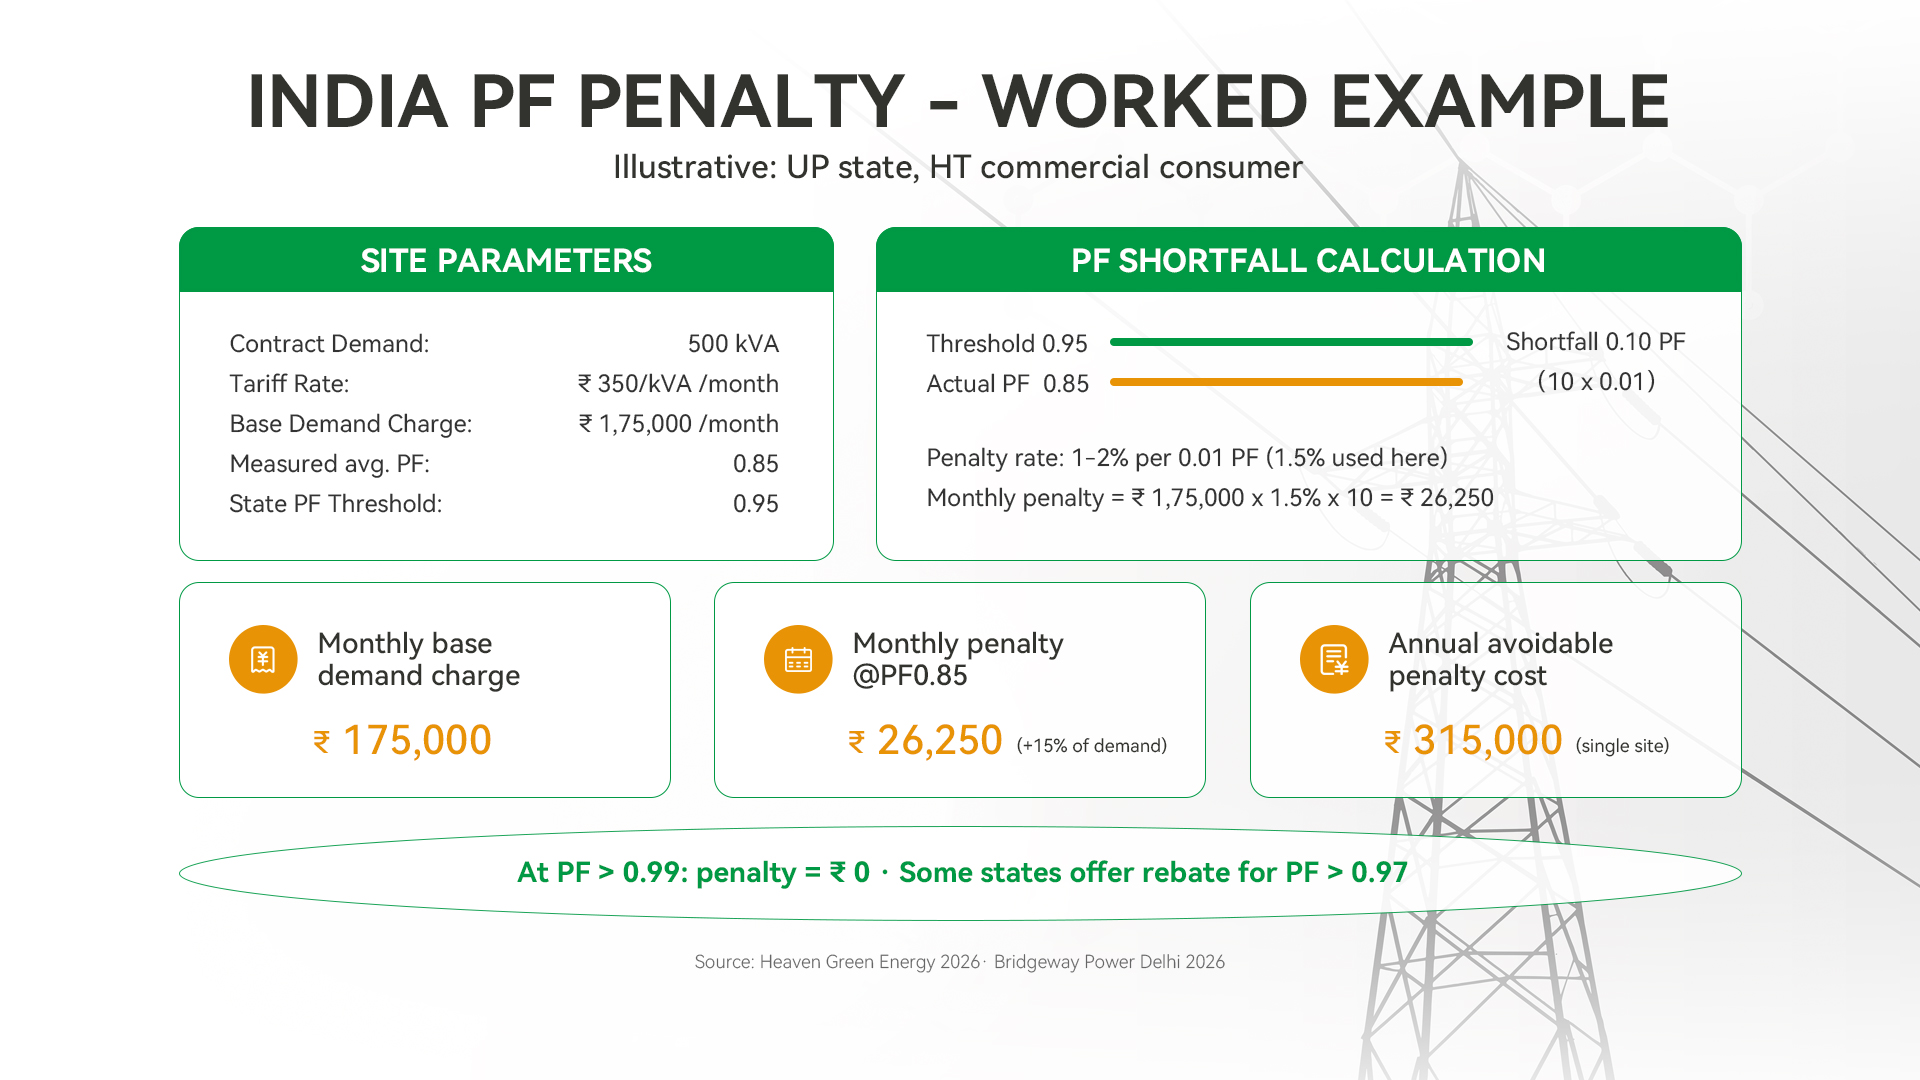
A worked example (UP, 500 kVA contract demand):
Base demand charge: ₹1,75,000 (500 kVA × ₹350/kVA/month) Measured average PF: 0.85 State threshold: 0.95 PF shortfall: 0.10 (10 increments of 0.01) Penalty rate: 1.5% per increment (illustrative; actual range 1–2% depending on state SERC tariff order) Monthly penalty: ₹1,75,000 × 0.015 × 10 = ₹26,250 Demand charge increase: 15%
Annualised, this penalty represents ₹3,15,000 per year in avoidable charges — for a single charging site. For a network operator running 20 locations under similar supply conditions, the aggregate is significant.[^3]
Some states offer PF rebates for consumers maintaining PF above 0.97 or 0.98. Where such rebates exist, a charging station with modules delivering PF ≥ 0.99 not only avoids the penalty bracket but qualifies for a credit — creating a double financial benefit relative to a station operating at PF 0.85-0.90.
Indonesia: PLN KVArh Charges for Commercial Tariff Categories
Under PLN's commercial and industrial tariff structure, large customers on categories B3 (business, >200 kVA), I3 and I4 (industrial), and P2 (government) are subject to a separate charge for excess reactive power consumption: biaya kelebihan pemakaian daya reaktif. This charge applies when the site's reactive power draw exceeds what is consistent with maintaining a power factor at or above the implicit threshold of approximately 0.85.[^1]
While Indonesia's tariff structure is less explicitly punitive than India's per-unit-PF-shortfall calculation, the practical effect for operators at large charging facilities is the same: reactive power drawn from the grid above the threshold generates a separate billing charge that adds to the monthly electricity cost. For charging stations on these tariff categories — including operators running commercial fleet charging depots and public fast charging facilities — high PF equipment reduces or eliminates this charge.
North America: Demand Charge Multipliers and kVAR Billing
In North American markets, utility power factor penalties are common for commercial and industrial accounts and typically activate when PF falls below 0.85 to 0.90. The two dominant billing mechanisms are:[^2]
Adjusted billing demand: Billing demand = Actual kW ÷ Measured PF (when below threshold). A charging station drawing 300 kW at PF 0.80 is billed on 375 kW (300 ÷ 0.80). At a demand charge of USD 15/kW, this creates a monthly penalty of USD 1,125 — an 25% increase in demand charges attributable entirely to power factor.
kVAR charges: Some utilities charge directly for reactive power at rates of USD 2–8 per kVAR per month. A facility drawing 100 kVAR above the threshold at USD 5/kVAR incurs USD 500/month — USD 6,000/year — in avoidable charges.

For charging station operators in US and Canadian markets, facilities paying USD 10,000–50,000 or more per year in PF-related demand charge adjustments are not unusual at high-power fast charging deployments, depending on station size, local utility rate structure, and average load factor.[^2]
How Active PFC Works in a Charging Module
Power factor correction in a DC fast charging module is not a passive component — it is an active circuit stage that operates continuously as part of the module's power conversion process.
The Problem Being Solved
Without power factor correction, a rectifier-based AC-DC converter draws current from the AC supply in a non-sinusoidal pattern: a series of high-amplitude current pulses at the peaks of the AC voltage waveform, rather than a smooth sinusoidal current in phase with the voltage. These current pulses contain substantial harmonic content (primarily 3rd, 5th, and 7th harmonics) and create a significant phase displacement between the current waveform and the voltage. Both effects reduce power factor and generate the reactive power that utility metering systems penalise.
How Active PFC Addresses This
Active Power Factor Correction (Active PFC) interposes a boost converter stage between the AC input and the DC bus. This stage operates at high switching frequency (typically in the range of tens of kilohertz) under the control of a digital signal processor that continuously shapes the input current waveform to track the AC voltage waveform as closely as possible.
The result is input current that is nearly sinusoidal and nearly in phase with the supply voltage — minimising both reactive power draw and harmonic injection. Modern high-performance Active PFC stages achieve input power factors above 0.99 and total harmonic distortion (THD) below 5%, as measured at the module's AC input terminals.
In Niuera's charging modules, the Active PFC stage is implemented under dual DSP digital control — the same control architecture that manages the full power conversion chain. At full load on the 30 kW module (X-EH-30K-TX series), power factor is ≥ 0.99 and THD ≤ 5%. The 60 kW SiC module (XSC60K/XEH60K/XSC60KFGEU-FAC series) achieves the same PF ≥ 0.99 and THD ≤ 5% specifications. Both figures are measured at rated full-load conditions and verified under CSA-certified laboratory testing.[^5]
)):)
The Financial Difference: ≥0.97 vs. ≥0.99
A power factor specification of 0.99 and a power factor specification of 0.97 look similar on paper. In practice, the difference matters across two distinct dimensions.
Dimension 1: Penalty Avoidance Margin
Most commercial electricity tariffs set PF thresholds in the range of 0.85 to 0.95. A charging module delivering PF ≥ 0.99 sits 0.04 to 0.14 above the typical threshold — a substantial buffer that ensures the station remains clear of penalty territory even as modules age, loads vary, and grid supply quality fluctuates. A module delivering PF ≥ 0.97 provides a smaller buffer.
More importantly, the operating PF of a charging module is not constant. It varies with load — most modules deliver lower PF at partial load than at full load. A module rated at PF ≥ 0.99 at full load may deliver PF ≥ 0.97 at 50% load. A module rated at PF ≥ 0.97 at full load may deliver lower PF at partial load, potentially crossing into the penalty zone during off-peak hours when utilisation is lower.
Dimension 2: Real-World Reactive Power Draw at Scale
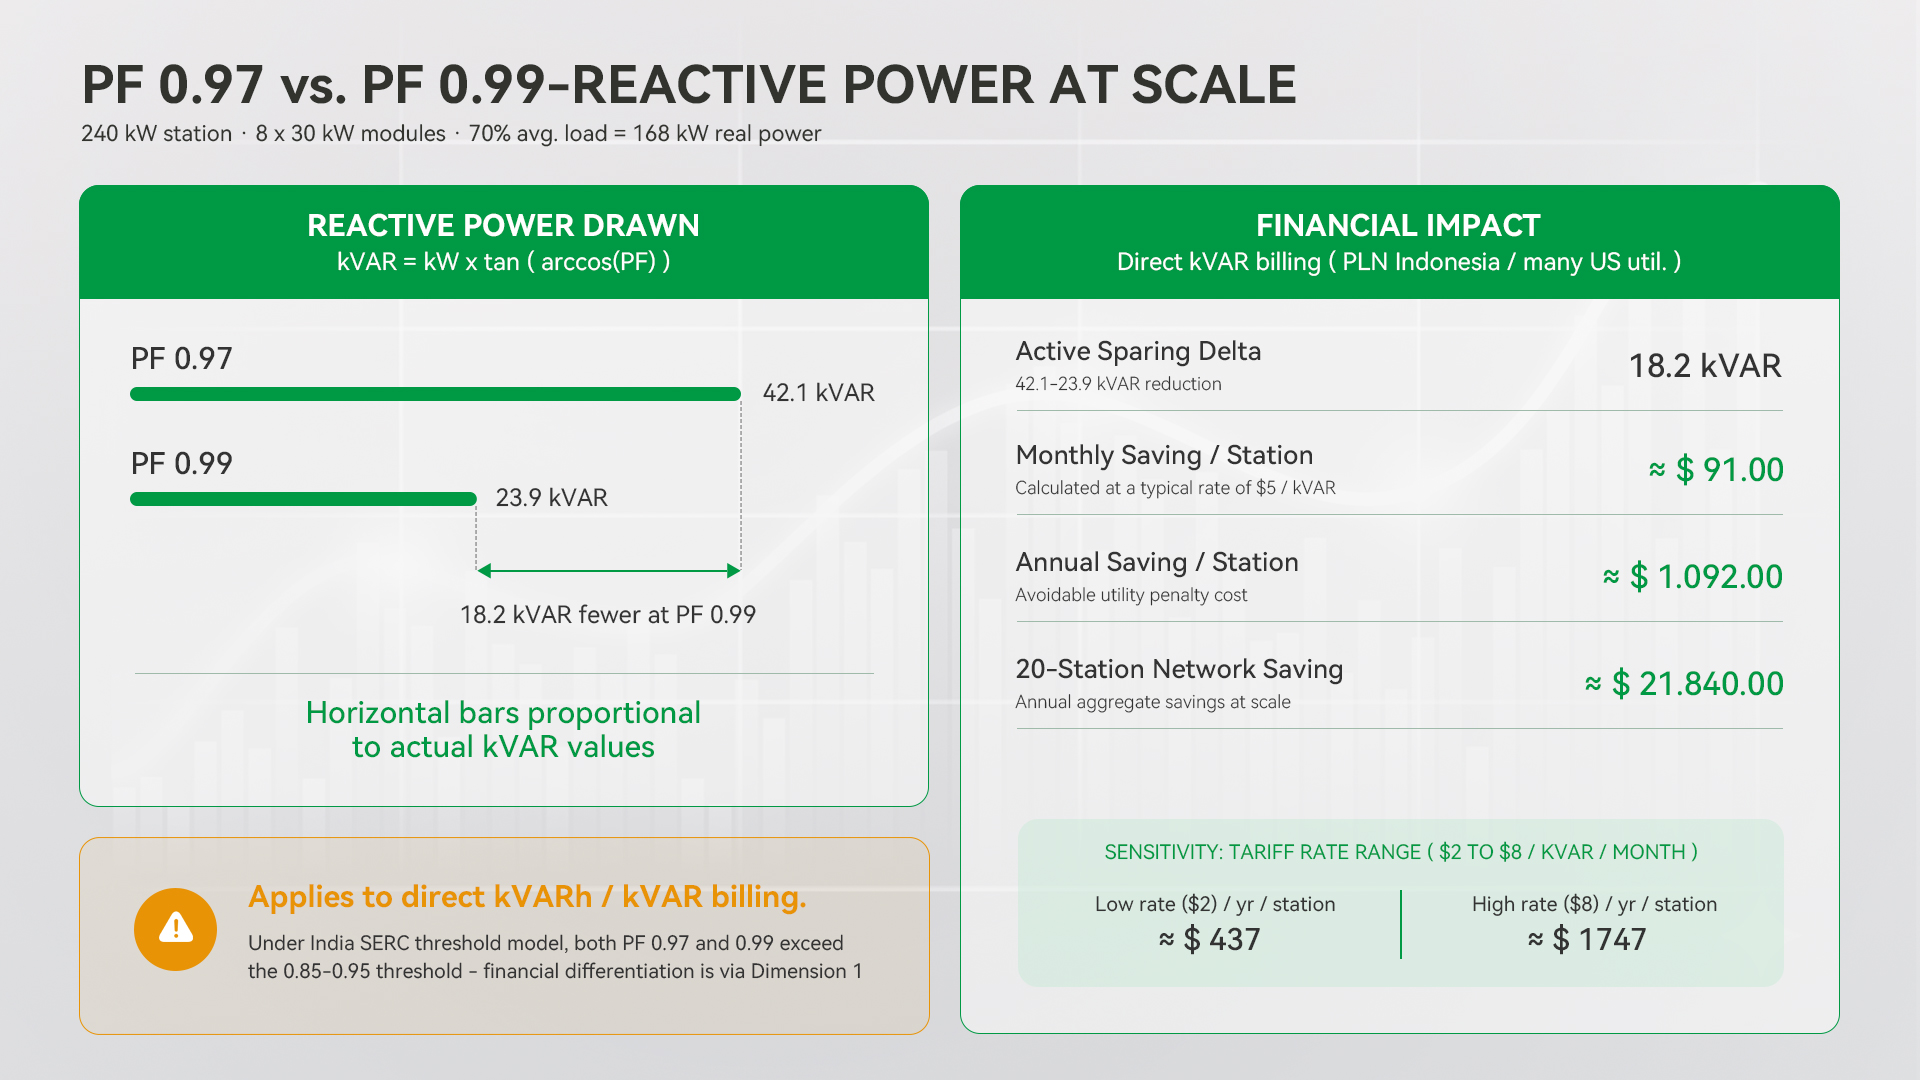
Consider a 240 kW charging station (8 × 30 kW modules) operating at an average load of 70% — a real power draw of 168 kW. The reactive power generated at each PF level is:
Reactive power calculation (kVAR = kW × tan(arccos(PF))):
|
PF = 0.97
|
PF = 0.99
|
|
|
Real power drawn (kW)
|
168 kW
|
168 kW
|
|
Apparent power (kVA)
|
168 ÷ 0.97 = 173.2 kVA
|
168 ÷ 0.99 = 169.7 kVA
|
|
Reactive power (kVAR)
|
168 × tan(arccos(0.97)) = 42.1 kVAR
|
168 × tan(arccos(0.99)) = 23.9 kVAR
|
|
kVAR difference
|
42.1 − 23.9 = 18.2 kVAR fewer at PF 0.99
|
—
|
|
Monthly saving @ USD 5/kVAR (direct kVAR billing)
|
—
|
~USD 91/month
|
|
Annual saving (single station)
|
—
|
~USD 1,090/year
|
kVAR formula: kVAR = kW × tan(arccos(PF)). All figures at 168 kW average load. USD 5/kVAR/month is a mid-range US utility kVAR demand charge rate (range USD 2–8/kVAR/month); this is a monthly flat charge per kVAR of reactive demand, not a per-kVARh energy rate. Confirm with local tariff. This table applies to utilities that charge a monthly kVAR demand charge or meter reactive power directly (as used by PLN Indonesia and many US utilities). Under threshold-based billing (India SERC model), both PF 0.97 and PF 0.99 clear the typical 0.85–0.95 threshold and the financial differentiation lies in the Dimension 1 penalty buffer, not kVAR demand charges.
The 18.2 kVAR reduction between PF 0.99 and PF 0.97 — at a mid-range US utility kVAR demand rate of USD 5/kVAR/month — produces a monthly saving of approximately USD 91 per 240 kW station, or approximately USD 1,090 per year. At a network scale of 20 stations, PF ≥ 0.99 vs. ≥ 0.97 represents approximately USD 21,800 per year in reduced reactive power charges — not from doing anything differently, but from specifying modules with a higher PF rating.
At the upper end of utility kVAR rates (USD 8/kVAR/month), the annual saving per station reaches approximately USD 1,750; at the lower end (USD 2/kVAR/month), approximately USD 437. The variation underscores why confirming the local utility's specific reactive power billing methodology — monthly kVAR demand charge, kVARh energy billing, or threshold-adjusted demand — is an important step in total cost of ownership modelling.
Note: Actual savings depend on the utility's specific tariff structure, metering method (kVARh direct billing vs. threshold-based adjusted demand), load profile, and local electricity rate. Nothing in this comparison constitutes a guarantee of financial outcomes at any specific site.
Grid Compatibility: The Emerging Market Dimension
In markets like India, Southeast Asia, and East Africa, PF matters for a reason beyond penalty avoidance: the quality and stability of the grid supply itself.
Voltage Stability and Grid Resilience
Reactive power management is central to voltage stability on distribution networks. When a charging station draws large amounts of reactive current from a distribution feeder — as it does when PF is low — this reactive current flow creates voltage drops along the feeder. At the end of a long rural distribution line serving a peri-urban area, a charging station with poor PF can measurably depress local voltage, reducing the charging performance of the station itself and affecting other loads on the same feeder.
A charging module with PF ≥ 0.99 draws almost entirely real (active) current from the supply. The reactive current draw is negligible, which means the impact on feeder voltage is proportionally reduced. This is not merely an academic benefit — in network environments where the utility's distribution infrastructure is operating near its design limits, high-PF equipment is meaningfully more compatible with the supply conditions than low-PF equipment.
THD and Grid Harmonic Pollution
Total Harmonic Distortion (THD) is related to power factor but distinct from it. High harmonic content in the current waveform increases the effective RMS current for a given real power level, contributing to additional I²R losses in the supply network and potentially interfering with other equipment on the same distribution network.
Niuera's modules specify THD ≤ 5%. For DC fast charging modules drawing current well above 16 A per phase — Niuera's 30 kW module draws approximately 43 A per phase at 400 VAC three-phase input, and the 60 kW SiC module approximately 87 A per phase — the applicable IEC harmonic standard is IEC 61000-3-12 (governing harmonic current emissions for equipment with input current greater than 16 A and up to 75 A per phase, connected to public low-voltage systems) and IEC 61000-3-4 for higher currents.[^6] THD ≤ 5% compliance with these limits matters for institutional and utility purchasers who specify harmonic performance requirements in procurement documents, and increasingly matters for charging network operators in markets where grid operators are tightening distribution network quality standards.
What This Means in Practice for Charging Network Operators
For operators planning new station deployments in India or Indonesia: Confirm the tariff category and PF threshold that will apply to your connection before finalising equipment specifications. If the site qualifies as an HT commercial or industrial consumer, PF performance is a direct operating cost variable. Specify the PF of individual charging modules at rated load — not the station-level PF after accounting for ancillary loads, which may be lower.
For operators building in North American markets with kVAR billing: Model the reactive power draw of your planned module configuration at 50%, 70%, and 100% load, not just at rated conditions. The penalty exposure is determined by your actual operating load profile, which rarely sustains 100% load continuously.
For operators deploying in peri-urban and rural locations with variable grid quality: High PF reduces the reactive current your station draws from a potentially stressed distribution feeder. This directly reduces the voltage impact of your station on the local network and reduces the risk of supply voltage dropping below the station's operational range during peak demand periods.
For operators evaluating total cost of ownership: Module PF is a procurement specification that determines electricity costs for the entire operational life of the station — typically 10+ years. A PF difference of 0.02 (0.97 vs. 0.99) that reduces reactive power draw by approximately 18 kVAR at a 240 kW station operating at 70% average load translates to USD 4,400–17,500 per year in avoided kVAR charges depending on local utility rates — and USD 44,000–175,000 over a ten-year station life, before accounting for tariff escalation. In India, where threshold-based penalties apply, the same PF improvement eliminates the risk of crossing into the penalty zone at partial load. This is meaningful context for evaluating the total cost of ownership of module specifications that may differ by a smaller amount in unit price.
Niuera Module PF Specifications
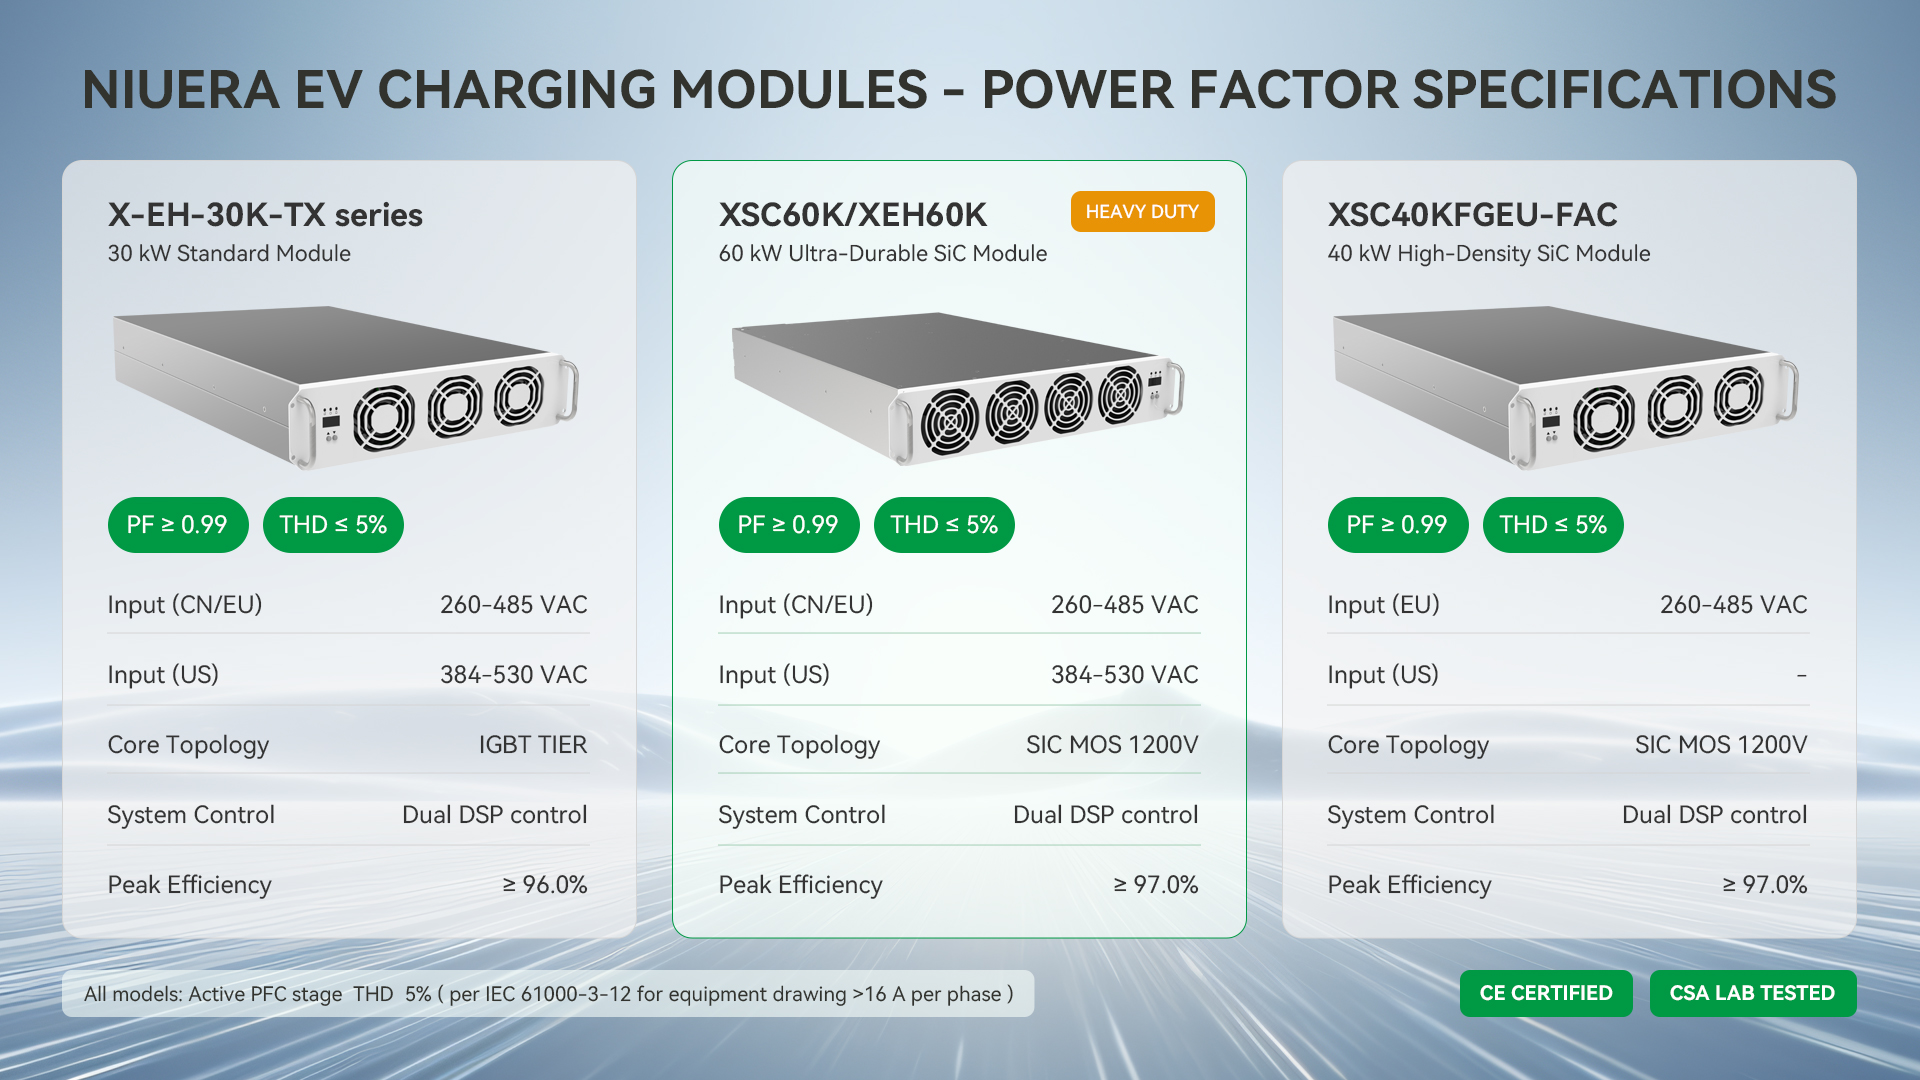
The following specifications are published on Niuera's product pages and were last verified in June 2026:[^5]
|
Model
|
Rated Power
|
Power Facto
|
THD
|
Input Voltage
|
|
X-EH-30K-TX series
|
30 kW
|
≥ 0.99
|
≤5%
|
260–485 VAC (CN/EU) / 384–530 VAC (US)
|
|
40kW SiC
|
≥ 0.99
|
≤5%
|
260–485 VAC (EU)
|
|
|
XSC60K / XEH60K / XSC60KFGEU series
|
60 kW Sic
|
≥ 0.99
|
≤5%
|
260–485 VAC (CN/EU) / 384–530 VAC (US)
|


All three models: Dual DSP digital control · Active PFC stage · THD ≤ 5% (per IEC 61000-3-12 for equipment >16 A/phase)[^6]
Frequently Asked Questions
Q: Is power factor the same as efficiency?
No — though they are related, they measure different things. Efficiency is the ratio of output power to input power: a 97% efficient 30 kW module converts 30 kW of output DC power from approximately 30.9 kW of input AC real power, with the remaining 0.9 kW lost as heat. Power factor is the ratio of real power to apparent power: a PF 0.99 module drawing 30.9 kW of real power draws approximately 31.2 kVA of apparent power, with 3.8 kVAR of reactive power. Both specifications matter independently. A module can be highly efficient with poor PF, or have excellent PF with only moderate efficiency. Niuera's modules specify both: efficiency (peak ≥ 96–97% depending on model) and power factor (≥ 0.99).
Q: At what load level does the PF ≥ 0.99 specification apply?
The PF specification is measured at rated full load conditions. Power factor of active PFC converters typically decreases at partial load — a module delivering PF ≥ 0.99 at 100% load may deliver PF ≥ 0.97 at 50% load, and somewhat lower at very light loads. For accurate site-level power factor modelling across a real load profile, request partial-load PF data from Niuera's engineering team. The station's average PF at typical utilisation rates, not just at peak load, is the figure that determines monthly reactive power charges.
Q: Does adding more modules to a station improve its overall PF?
No. Power factor is a characteristic of each individual module's input stage and does not improve with parallelisation. A station with eight 30 kW modules all delivering PF ≥ 0.99 achieves an overall station PF close to ≥ 0.99 (subject to the contribution of ancillary loads such as HVAC, lighting, and control systems, which may reduce the total station PF slightly). A station with modules delivering PF 0.90 achieves an overall station PF close to 0.90 regardless of how many modules are installed.
Q: How does PF interact with the transformer and cable sizing for a charging station connection?
Directly — and significantly. The transformer and cables serving a charging station must be sized for the apparent power (kVA) the station draws, not the real power (kW). A 240 kW station with PF 0.99 draws approximately 242 kVA, requiring a transformer rated for at least that capacity. The same station with PF 0.85 draws approximately 282 kVA — 17% more transformer and cable capacity for the same charging output. Where the utility charges a connection fee based on contracted kVA capacity, or where the site's existing transformer is near its rated capacity, high PF directly reduces the connection upgrade requirement and its associated capital cost.
What to Do Next
Request Niuera module specification sheets: → 30 kW Charging Module (X-EH-30K-TX) → → 40 kW SiC Charging Module (XSC40KFGEU-FAC) → → 60 kW SiC Charging Module (XSC60K/XEH60K series) →
Discuss your site's grid connection requirements: → Contact our application engineering team →
References
[^1]: mrfixitbali.com. Cost of PLN Electricity in Indonesia — Tariff Categories B3, I3, I4, P2: KVArh Reactive Power Charges. 2023 data, structure unchanged as of June 2026. //www.mrfixitbali.com/electrical/electricity-supply/electricity-cost-Indonesia-240.html
[^2]: CalcPanel. Power Factor Penalty Explained: Utility Cost Formulas, Examples & Savings (2026). May 11, 2026. //calcpanel.com/guides/power-factor-penalty-utility-rules-cost-impact; EleCalculator. Power Factor Penalty Calculator. February 15, 2026. //www.elecalculator.com/calculator/power/power-factor-penalty/
[^3]: Heaven Green Energy. Power Factor Penalty: Meaning, Definition, Benefits and FAQs — India SERC Framework. June 2026. //www.heavengreenenergy.com/glossary/power-factor-penalty
[^4]: Bridgeway Power. Commercial Electricity Rate in Delhi 2026: Power Factor Penalties. May 2026. //bridgewaypower.in/blog/electricity-bill-too-high-delhi-commercial
[^5]: Niuera Energy. 30 kW EV Charging Module (X-EH-30K-TX), 60 kW SiC Charging Module (XSC60K/XEH60K series) — Product Specifications. Verified June 2026. //www.niueraenergy.com/products/30kw-ev-charging-module.html; //www.niueraenergy.com/products/60kw-sic-charging-module.html
[^6]: IEC 61000-3-12 Ed. 2.0 (2011). Electromagnetic compatibility (EMC) — Limits for harmonic currents produced by equipment connected to public low-voltage systems with input current >16 A and ≤75 A per phase. International Electrotechnical Commission. For equipment drawing above 75 A per phase, see IEC 61000-3-4. IEC 61000-3-2 applies to equipment with input current ≤16 A per phase and is not applicable to high-power DC fast charging modules.
All product specifications sourced from Niuera Energy's official product pages as verified in June 2026. Reactive power penalty calculations are illustrative examples based on published utility tariff structures; actual charges depend on local utility rate schedules, metering methodology, billing period, and load profile. Nothing in this article constitutes financial or engineering advice specific to any individual installation. Operators should verify applicable tariff structures with their local utility before relying on any cost estimates.


About Niuera Energy Suzhou Niuera Energy Co., Ltd. designs and manufactures EV charging modules and infrastructure solutions for global markets. The company's DC fast charging module range — including the 30 kW (X-EH-30K-TX series), 40 kW SiC (XSC40KFGEU-FAC), and 60 kW SiC (XSC60K/XEH60K series) — is deployed in charging stations operated by network operators across North America, Europe, Southeast Asia, and Africa. All models carry CE certification and are tested in CSA-certified laboratory facilities.
www.niueraenergy.com | info@niuera.cn | +86-512-68303879
Charging the Boda-Boda: How East Africa's Electric Motorcycle Boom Is Reshaping the Charging Question
3.6 kW or 6.6 kW? A Practical Deployment Guide for Electric Motorcycle Charging Operators
Related blog