3.6 kW or 6.6 kW? A Practical Deployment Guide for Electric Motorcycle Charging Operators
Business Line: BL3 — Electric Motorcycle Charging Estimated Read Time: 11 minutes
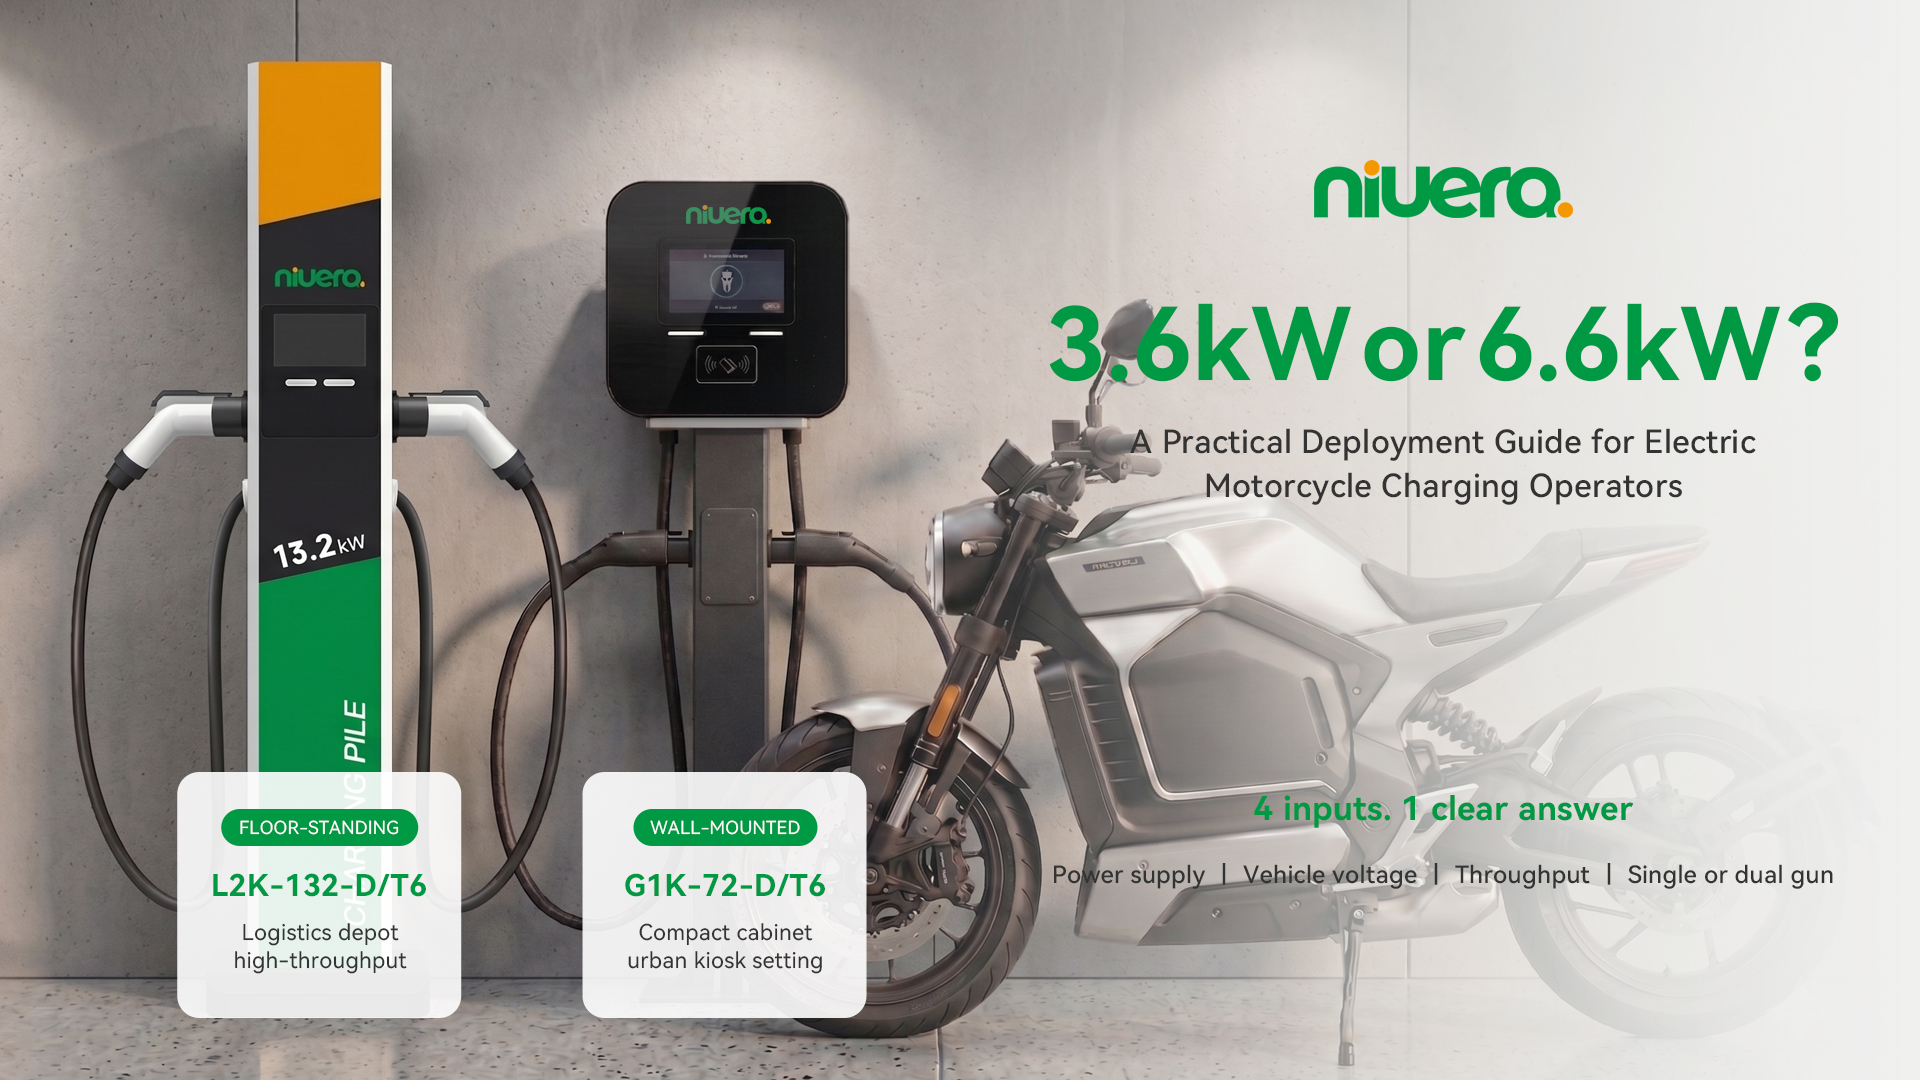
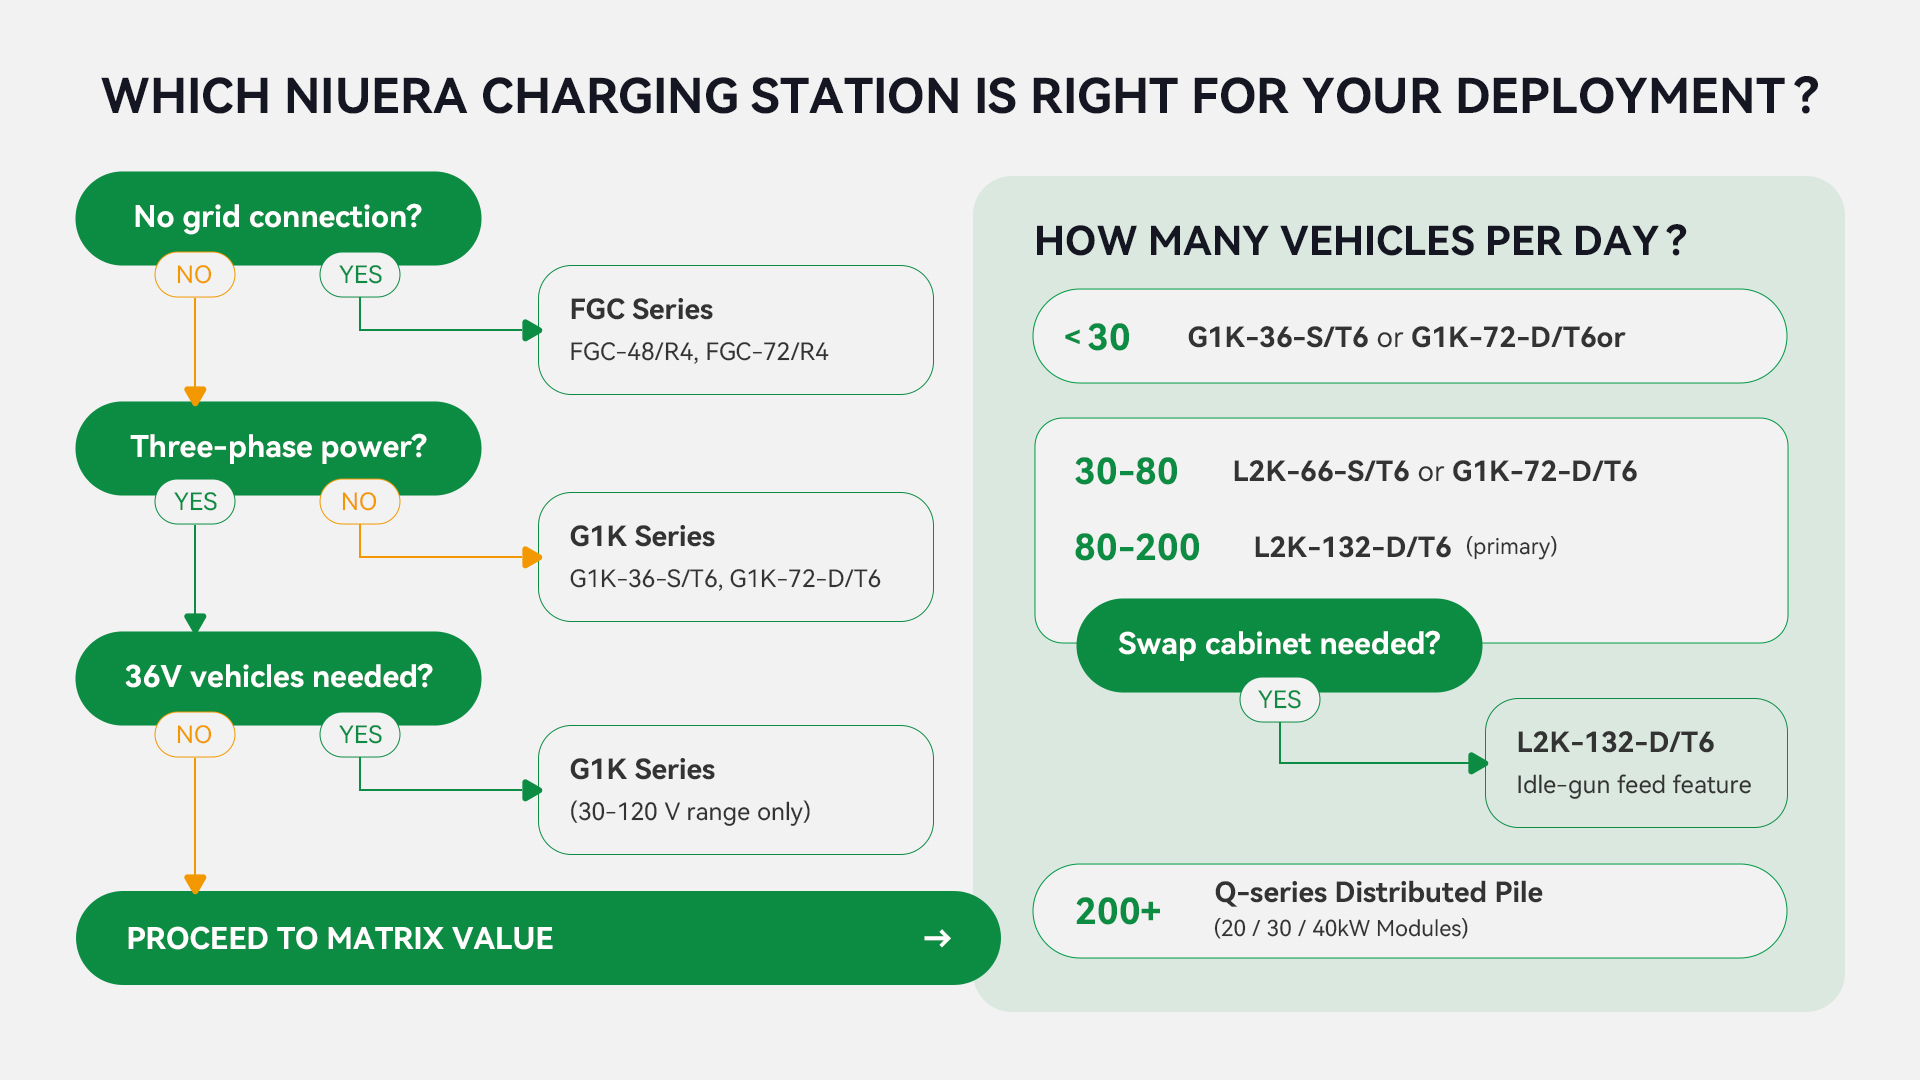
Which Charging Station Is Right for Your Deployment?
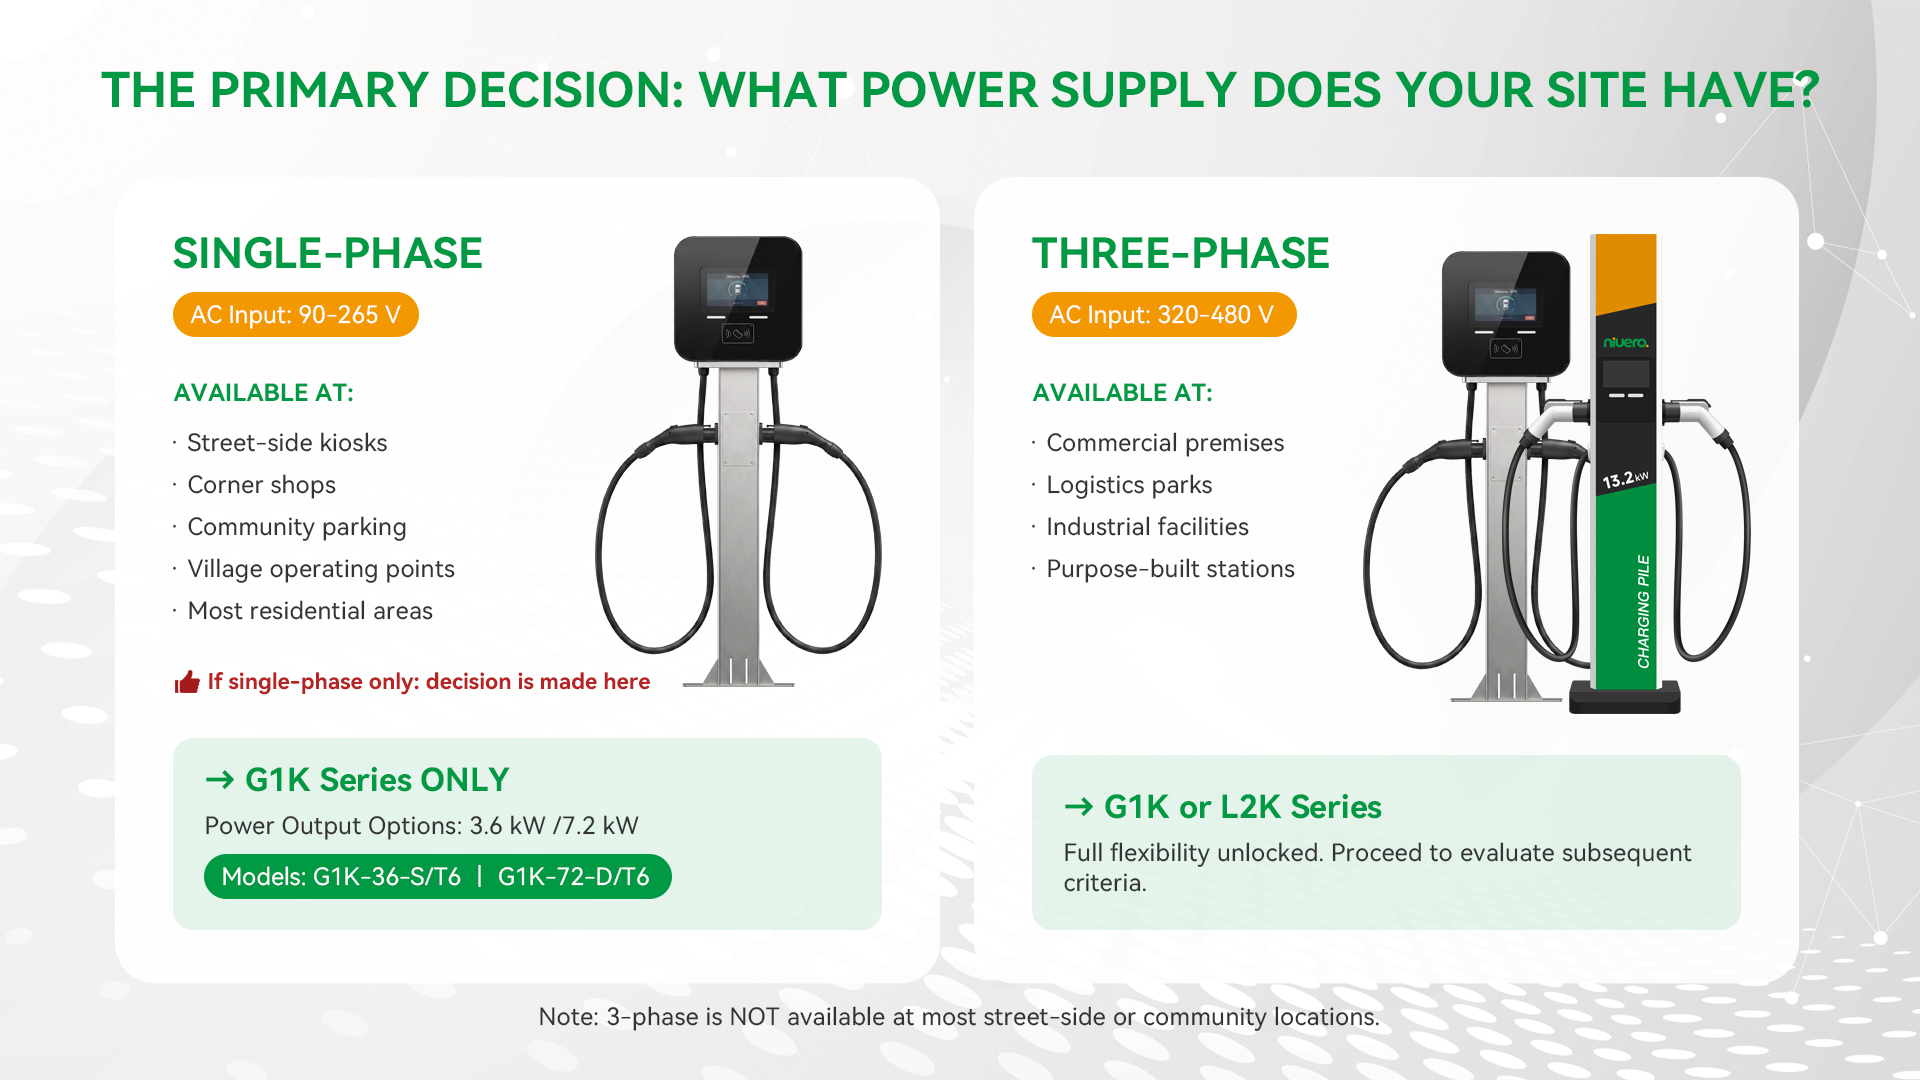
Input 1: Power Supply — The Primary Decision Point
Input 2: Vehicle Compatibility — What Voltage Are You Charging?
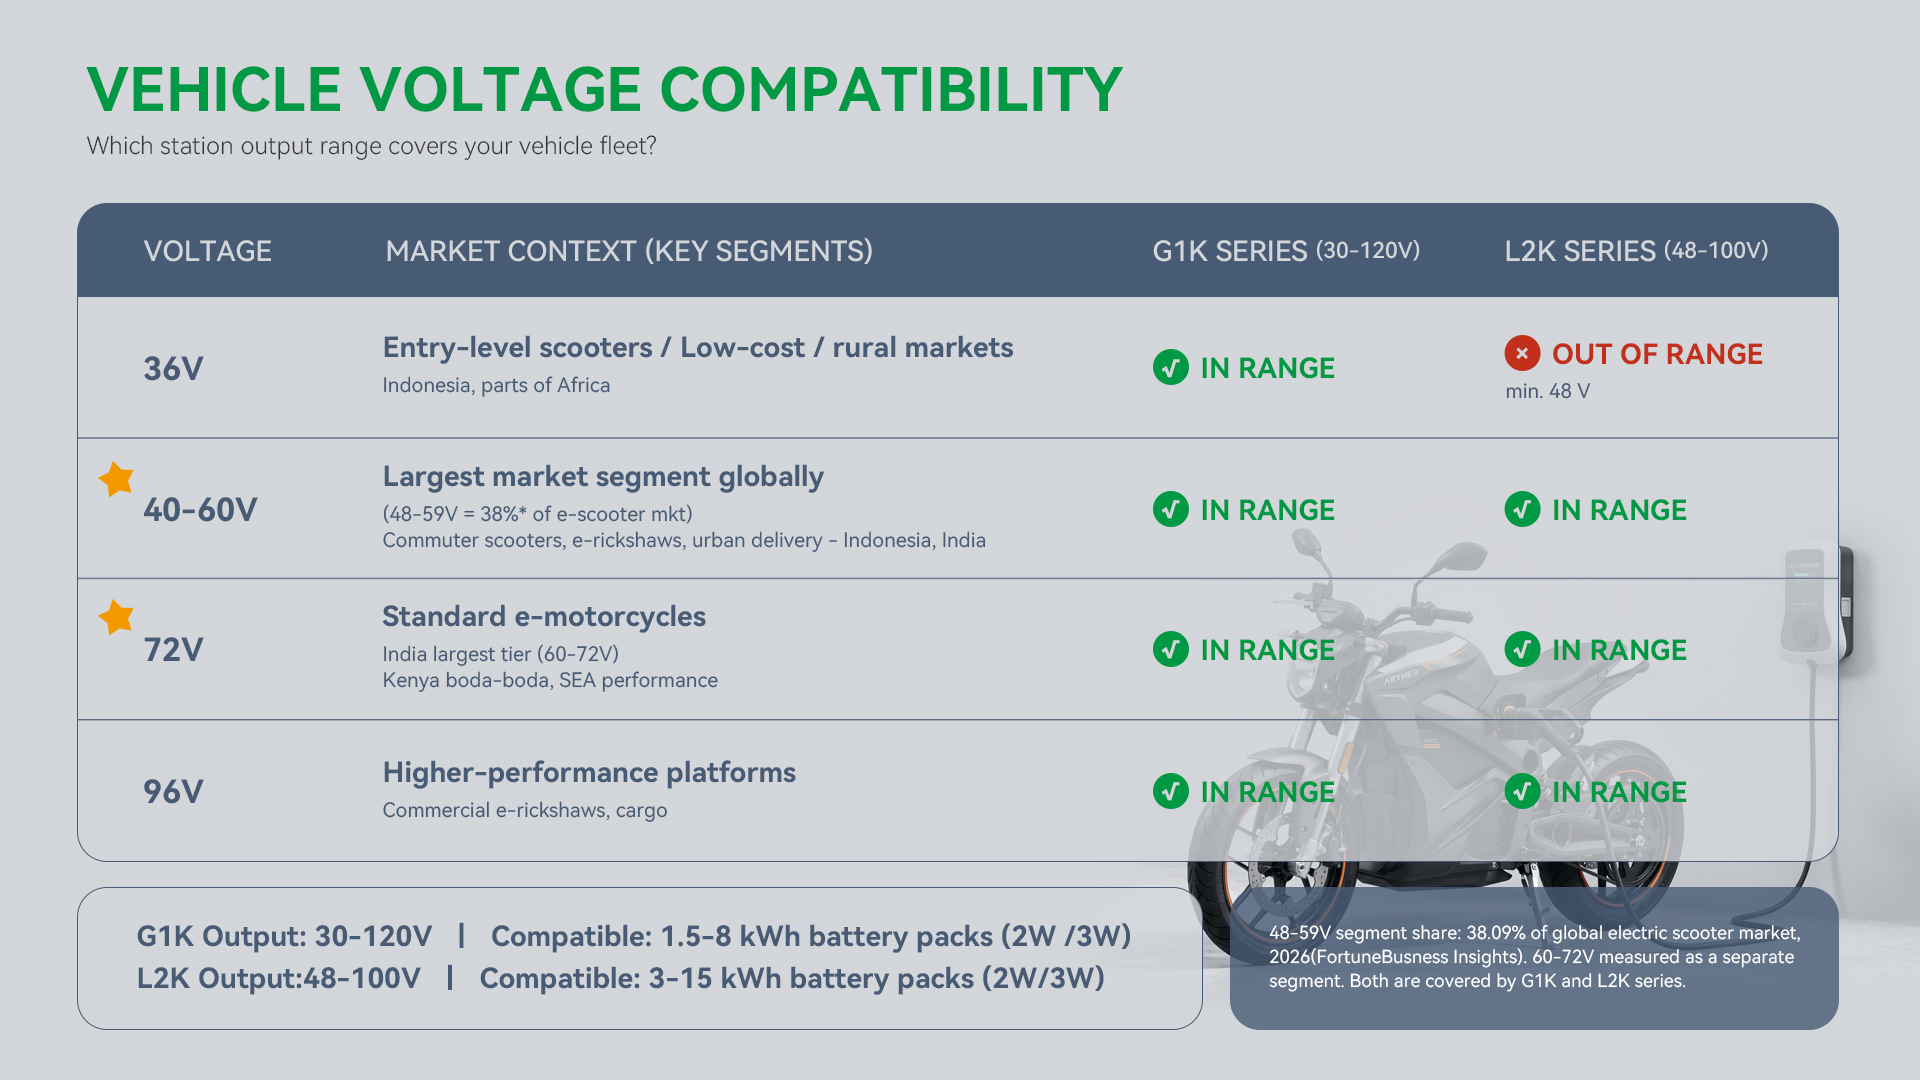
How the two product families map to this landscape:
| Vehicle / battery voltage | G1K series (output 30–120V) | L2K series (output 48–100V) |
| 36V entry-level scooters | ✅ Compatible | ❌Outside range |
| 48V commuter scooters | ✅ Compatible | ✅ Compatible |
| 60V urban delivery bikes | ✅ Compatible | ✅ Compatible |
| 72V standard e-motorcycles | ✅ Compatible | ✅ Compatible |
| 96V higher-performance models | ✅ Compatible | ✅ Compatible |
Input 3: Throughput — How Many Vehicles Per Day?
| Model | Power | Charge time (reference) | Max throughput per gun per hour* |
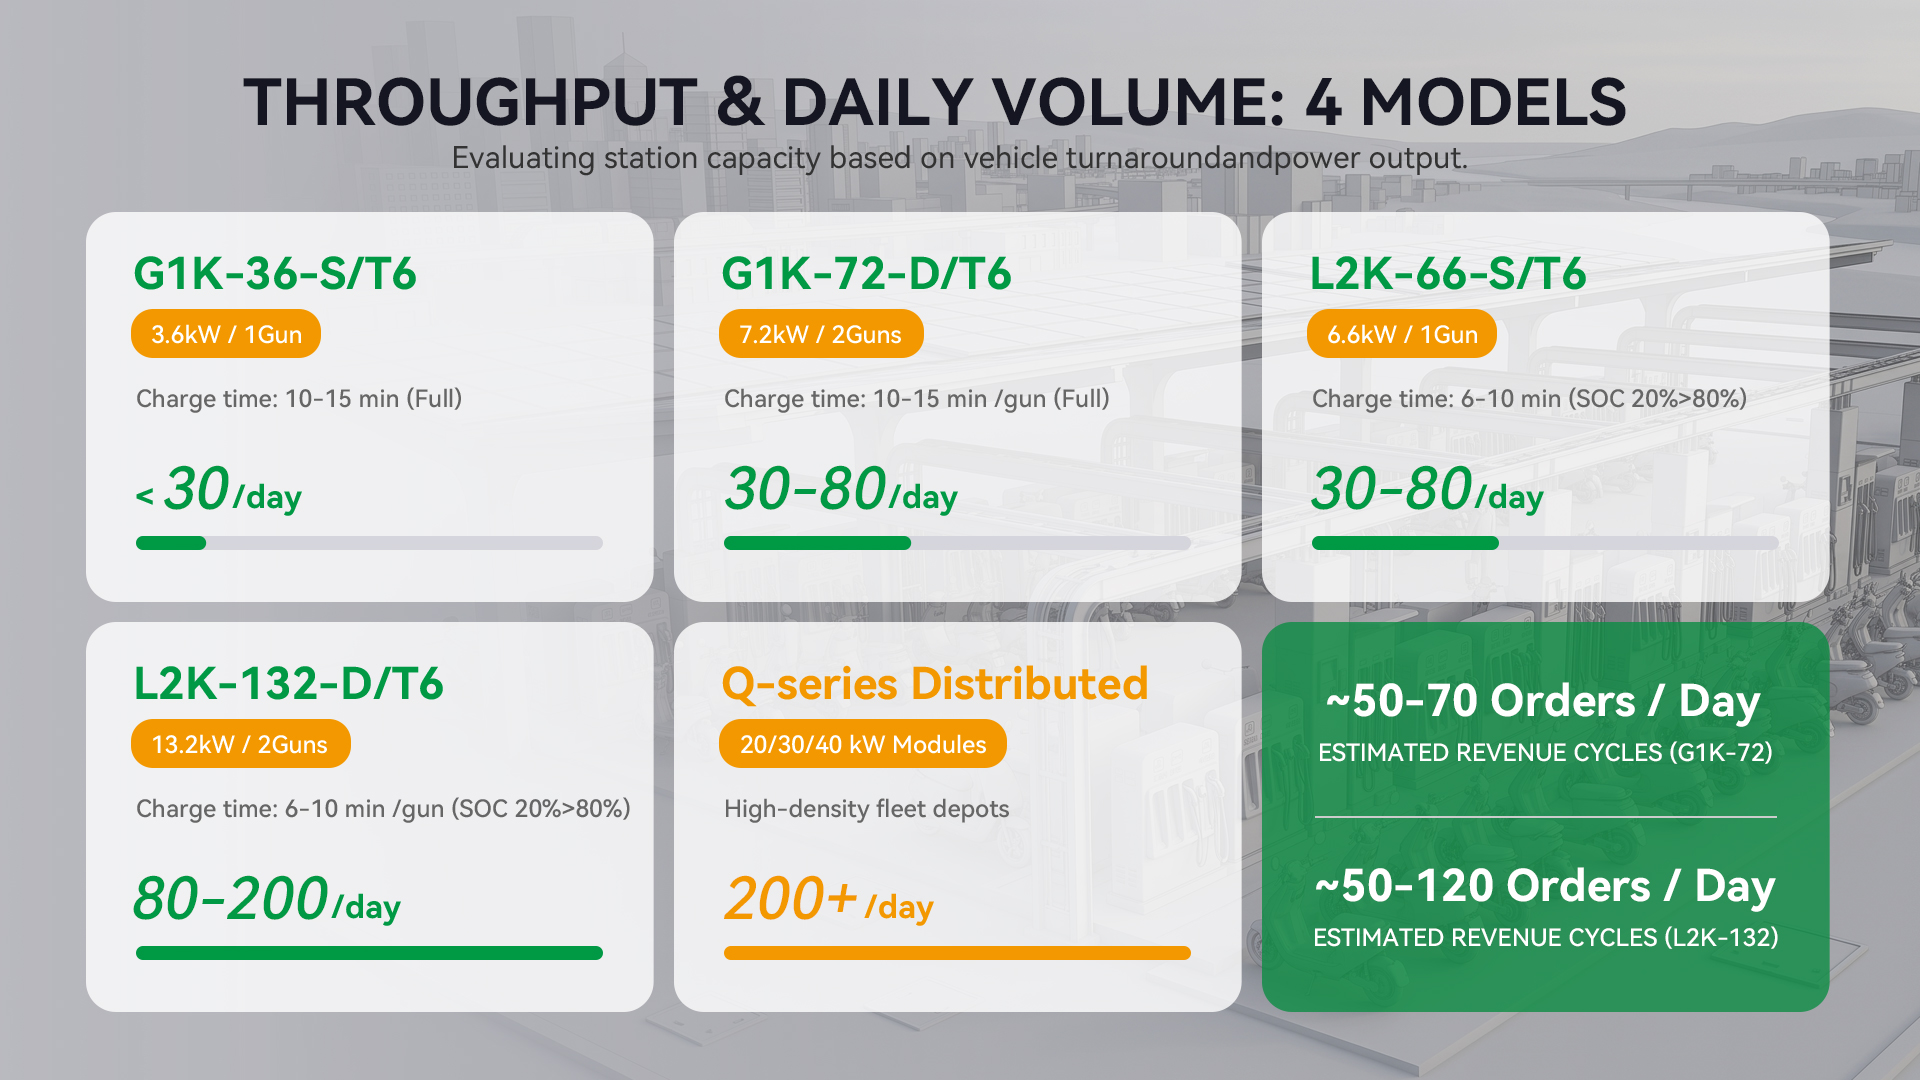
| G1K-36-S/T6 | 3.6 kW | ~10–15 min (72V 50Ah full recharge) | ~4–6 vehicles |
| G1K-72-D/T6 | 7.2 kW (2 guns) | ~10–15 min per gun | ~8–12 vehicles total |
| L2K-66-S/T6 | 6.6 kW | ~6–10 min (72V 50Ah, SOC 20%→80%) | ~6–10 vehicles |
| L2K-132-D/T6 | 13.2 kW (2 guns) | ~6–10 min per gun | ~12–20 vehicles total |
-
Fewer than 30 vehicles per day: G1K-72-D/T6 dual-gun handles this comfortably.
-
30–80 vehicles per day: Both L2K single-gun and G1K dual-gun are viable; L2K provides better headroom.
-
80–200 vehicles per day: L2K-132-D/T6 dual-gun is the appropriate choice.
-
200+ vehicles per day at a single location: Consider the Q-series Distributed Charging Pile (see callout below).
Input 4: Single Gun or Dual Gun?
-
G1K: single-gun USD 800 → dual-gun USD 1,100 (~37% premium) (indicative pricing; confirm with Niuera sales team)
-
L2K: single-gun USD 850 → dual-gun USD 1,300 (~53% premium) (indicative pricing; confirm with Niuera sales team)
-
Your location has multi-vehicle demand during peak hours where a single gun creates a queue
-
You want to future-proof a location against growing demand without replacing hardware
-
The additional throughput revenue offsets the premium within a reasonable payback window
-
You are testing a new location and want to minimise initial outlay before demand is proven
-
Daily volume is consistently below the single-gun capacity ceiling
-
Electrical load or space constraints make a second gun impractical at this stage
Deployment Scenarios: Matching Product to Context
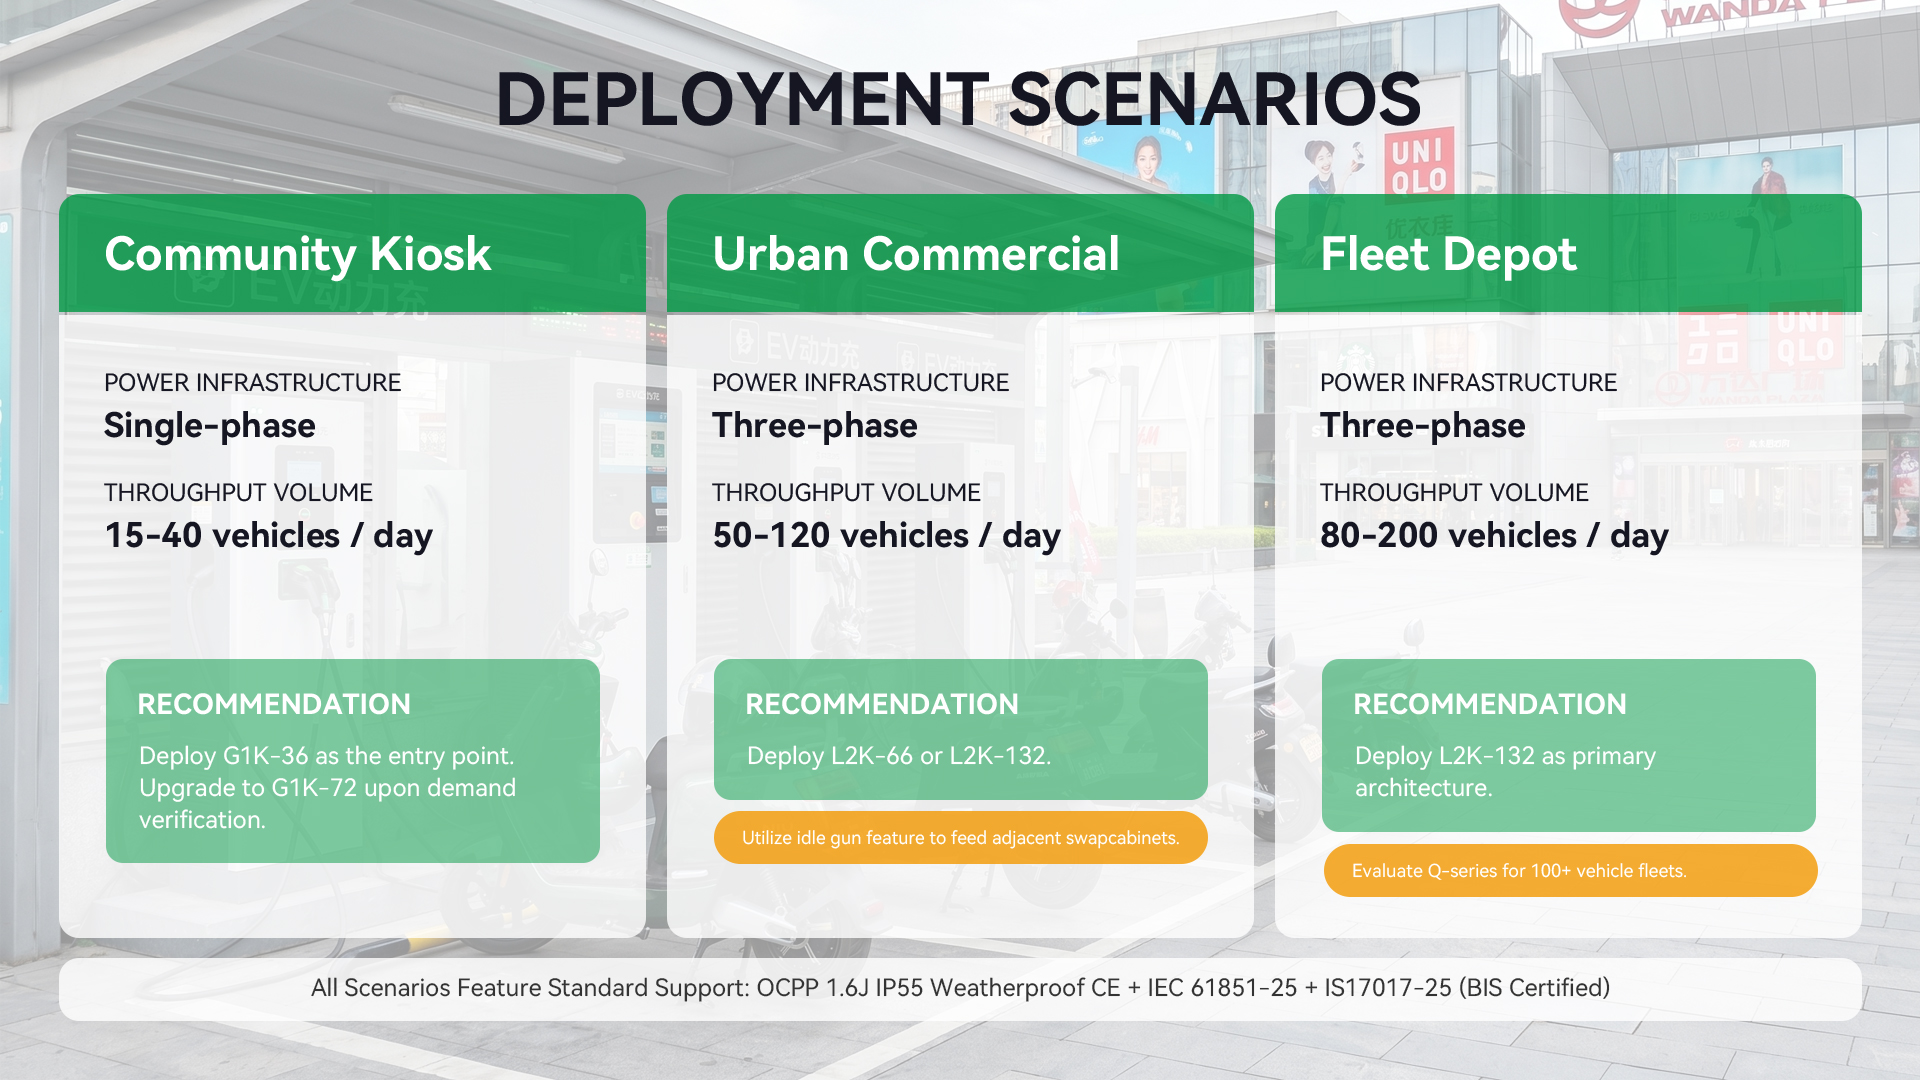
Scenario A — Community Kiosk or Street-Side Deployment
Scenario B — Urban Commercial Charging Point
Scenario C — Fleet Depot or Delivery Platform Facility
| Model | Main unit | Terminal piles | Peak efficiency |
| Q1K-2K-4/T6 | 20 kW | 4–6 | ≥96% |
| Q2K-3K-6/T6 | 30 kW | 6–8 | ≥96% |
| Q3K-4K-8/T6 | 40 kW | 8–10 | ≥97% |
Summary Decision Framework
A Note on Certification
Frequently Asked Questions
Next Steps
References
[^1]: Fortune Business Insights. Electric Scooter Market Size, Share & Growth Forecast 2034 — Voltage Segmentation. 2026. //www.fortunebusinessinsights.com/electric-scooter-market-102056
[^2]: Future Market Insights. Electric Motorcycles and Scooters Market — Voltage Segmentation, 2025. August 4, 2025. //www.futuremarketinsights.com/reports/electric-motorcycles-and-scooters-market
[^3]: Market Research Future. India Electric Scooter Market — Voltage Segmentation. April 2026. //www.marketresearchfuture.com/reports/india-electric-scooter-market-12441
[^4]: Alibaba Seller Blog. Electric Motorcycle Voltage Systems: Southeast Asian Market Preferences. April 3, 2026. //seller.alibaba.com/blogs/2026/southeast-asia/electric-motorcycles/voltage-system-comparison-48v-60v-72v-alibaba-guide
[^5]: TradeIndia / Seltrik Electric India. E-Rickshaw Battery Voltage Specifications: 48V, 60V, 72V. 2026. //www.tradeindia.com/question-answer/what-capacity-battery-is-used-in-e-rickshaw/; //seltrik.com/blogs/all-blogs/e-rickshaw-battery-price-types-backup
[^6]: Niuera Energy. G1K and L2K Series Product Specifications; Q-series Distributed Charging Pile; FGC-48/R4 and FGC-72/R4. Confirmed from product documentation. //www.niueraenergy.com
Product specifications sourced directly from Niuera Energy product documentation. Market data sourced from third-party publications as referenced. Charging times per product documentation; actual results vary with battery condition, ambient temperature, and vehicle BMS behaviour. Pricing figures are indicative; confirm current commercial pricing with Niuera's sales team. Nothing in this article constitutes a binding product specification or deployment guarantee.

Power Factor Correction in EV Charging: What ≥0.99 PF Means for Your Grid Connection and Energy Bill
Trade Barriers and Local Assembly: How Tariff Shifts in 2026 Are Changing EV Charging Economics